
Abstract
Increasing concurrency did not monotonically improve serving capacity in a controlled vLLM experiment on an A100. With Qwen2.5-3B-Instruct, mean output throughput increased from 4,255.64 tok/s at concurrency 64 to 4,996.44 tok/s at 128, then fell to 4,773.80 tok/s at 256. Three balanced repeats reproduced the C128 > C256 ordering in every run, with coefficients of variation below 0.4%.
The higher-concurrency regime was also substantially worse on latency. From C128 to C256, mean TTFT increased from 419.7 ms to 746.4 ms, p99 TTFT from 2.05 s to 4.58 s, and mean TPOT from 22.37 ms to 47.82 ms. A fresh-host clean-room reproduction preserved the same throughput ordering in all three repeats despite modest movement in absolute performance.
Nsight Systems showed that the post-knee regime was not caused by GPU idleness: kernel-active time remained approximately 98%. Instead, the added GPU cost was concentrated in a mixed/prefill-containing FlashAttention path. Between C128 and C256, its sustained sequence population increased from 108.83 to 218.00, while mean kernel duration increased from 353.85 µs to 708.88 µs.
Inspection of the exact vLLM 0.27.1 V1 scheduler source provides a systems mechanism consistent with that regime change: continuous batching operates under a shared 2,048-token scheduling budget.
1. The concurrency knee
Concurrency is one of the most obvious controls in an inference server.
At low concurrency, increasing the number of requests in flight can improve batching opportunities and expose more parallel work to the GPU. It is therefore tempting to think about concurrency as a mostly monotonic capacity knob: increase it until throughput stops improving.
That expectation held initially.
Mean output throughput increased from 4,255.64 tok/s at C64 to 4,996.44 tok/s at C128, a gain of approximately 17.4%.
Increasing maximum concurrency again to 256 did something different.
Throughput fell to 4,773.80 tok/s.
A few percentage points are not enough to trust from one benchmark. Initialization effects, experiment ordering, background variation, or ordinary run-to-run noise could easily create an apparent regression of that size.
So before trying to explain C256, I first tested whether the ordering itself was repeatable.
The serving setup was deliberately narrow. I ran vLLM 0.27.1 with Qwen2.5-3B-Instruct on a single NVIDIA A100-SXM4-80GB, using BF16 and no tensor, pipeline, or data parallelism. Maximum model length was fixed at 8,192, GPU memory utilization at 0.50, prefix caching was disabled, and V1 chunked prefill remained enabled.
The synthetic workload used nominal 512-token inputs and 128-token outputs, a fixed seed, and request_rate=inf. This was therefore a saturation experiment rather than an arrival-rate experiment: demand remained backlogged while max_concurrency constrained the number of simultaneous in-flight requests.
| Concurrency | Prompts |
|---|---|
| 64 | 512 |
| 128 | 1,024 |
| 256 | 2,048 |
A persistent server was warmed before measurement. The three repetitions used balanced point ordering rather than always running C64 → C128 → C256 in the same sequence.
The result was highly stable.
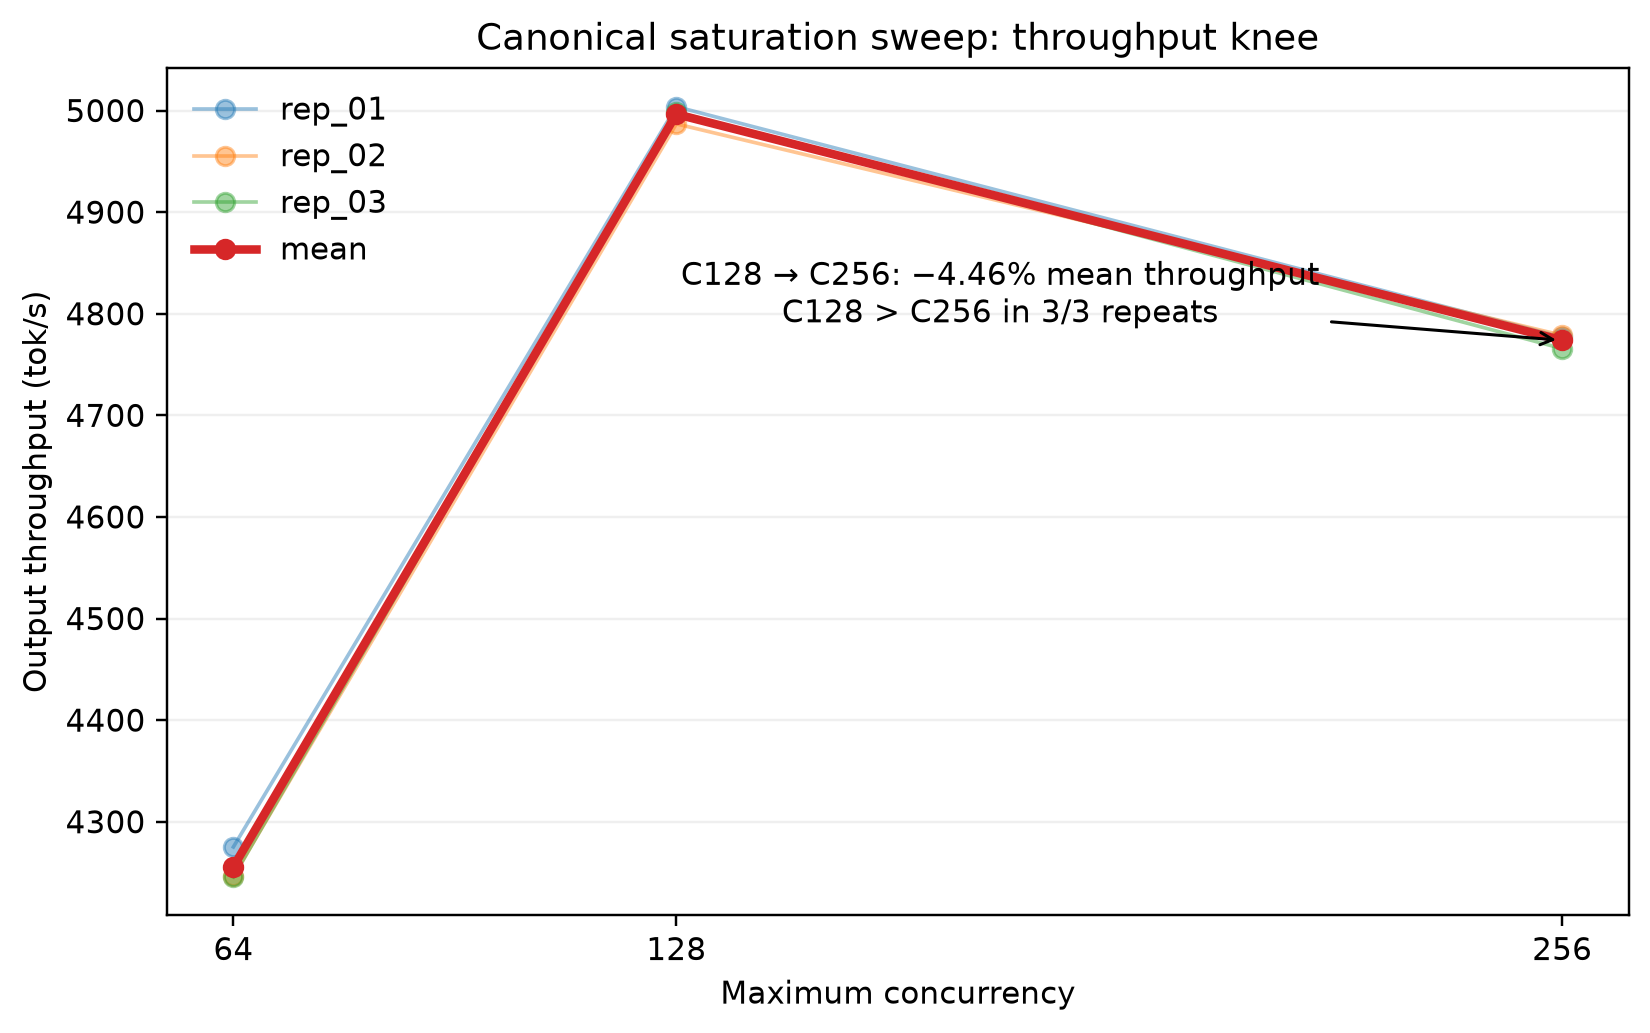
| Maximum concurrency | Mean output throughput | CV |
|---|---|---|
| 64 | 4,255.64 tok/s | 0.398% |
| 128 | 4,996.44 tok/s | 0.174% |
| 256 | 4,773.80 tok/s | 0.148% |
C128 beat C256 in all three paired comparisons. The mean paired advantage was 4.664%.
The relevant phenomenon was therefore not “one C256 benchmark happened to be slower.”
Under this controlled workload, the system had entered a reproducible concurrency knee: increasing concurrency improved throughput up to C128, then pushed the server into a worse regime at C256.
The next question was whether that throughput loss bought anything in latency.
It did not.
2. C256 is a dominated operating point
A lower-throughput configuration is not automatically inferior.
A system might sacrifice some aggregate throughput for better latency, fairness, memory behavior, or another operational objective.
C256 moved in the opposite direction.
| Metric | C128 | C256 | Change |
|---|---|---|---|
| Output throughput | 4,996.44 tok/s | 4,773.80 tok/s | −4.46% |
| Mean TTFT | 419.7 ms | 746.4 ms | +77.8% |
| p99 TTFT | 2.05 s | 4.58 s | +123.4% |
| Mean TPOT | 22.37 ms | 47.82 ms | +113.7% |
| p99 TPOT | 25.06 ms | 53.11 ms | +111.9% |
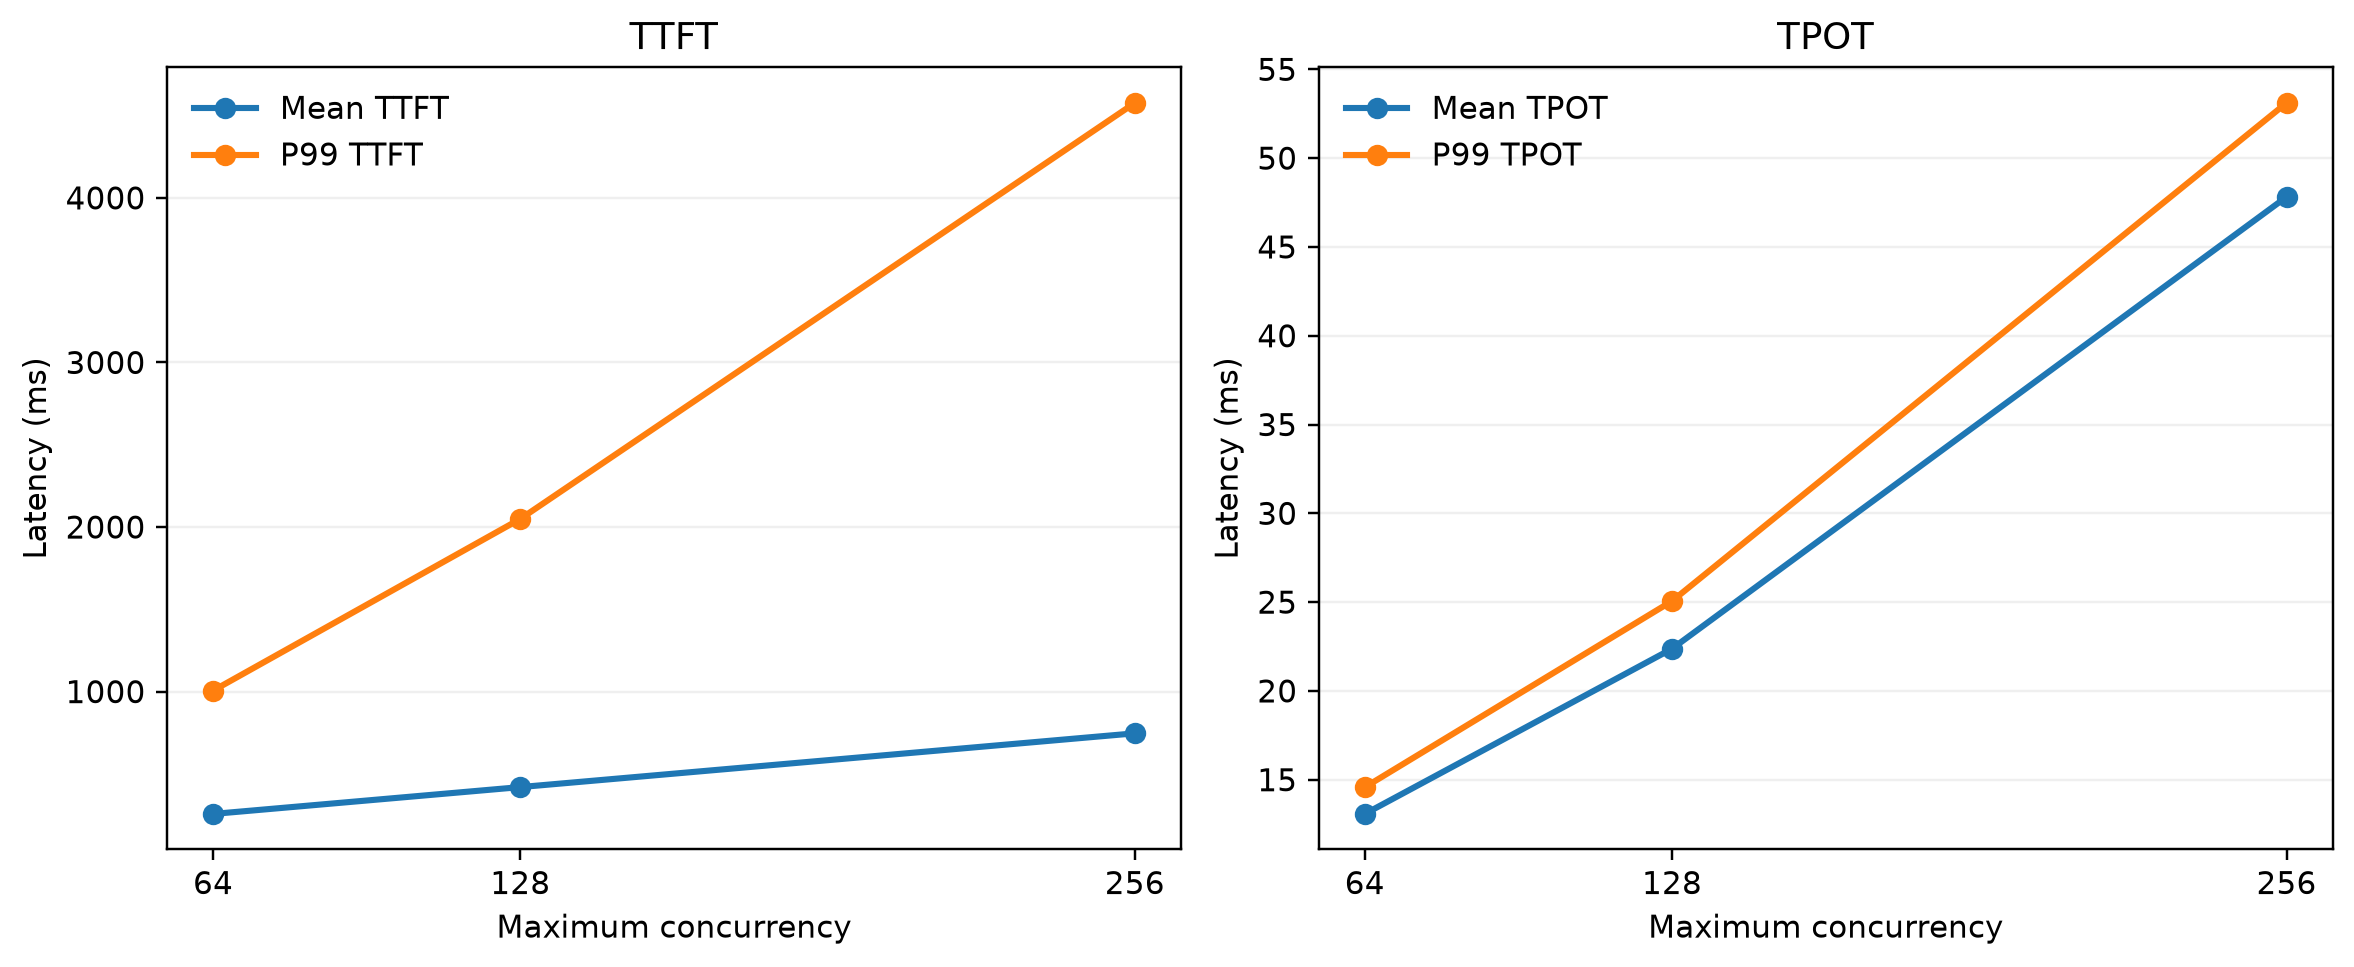
C256 is therefore a dominated operating point for this workload: fewer output tokens per second, substantially longer waits for the first token, and substantially slower token generation afterward.
That distinction is more operationally important than the raw 4–5% throughput difference.
A server may be capable of accepting more concurrent work long after doing so has stopped being useful.
maximum concurrency ≠ maximum throughput ≠ production capacity ≠ SLO-qualified capacity
The experiment does not define a production SLO, so I do not manufacture a numerical SLO-qualified capacity after the fact. But the dominance result already establishes that maximum concurrency is not a meaningful capacity metric by itself.
Before profiling the knee, I wanted one stronger reproducibility test.
3. The ordering survives a clean-room reproduction
The canonical experiment established repeatability within one controlled environment.
I then rebuilt the experiment on a fresh A100 host using an immutable runtime image, an exact Git commit, and the exact model revision, with no state reused from the original machine.
Absolute throughput moved by a few percent:
| Concurrency | Canonical | Fresh-host clean-room |
|---|---|---|
| 64 | 4,255.64 tok/s | 4,114.36 tok/s |
| 128 | 4,996.44 tok/s | 4,814.48 tok/s |
| 256 | 4,773.80 tok/s | 4,559.83 tok/s |
But the regime ordering survived:
C64 < C128 > C256
C128 again beat C256 in all three repeats. The mean paired advantage was 5.586%, compared with 4.664% in the canonical experiment.
That is the reproduction result that matters here.
A fresh cloud host does not need to reproduce identical tokens-per-second values for the underlying systems phenomenon to survive. Absolute performance shifted modestly, but the concurrency knee and C128 > C256 ordering remained.
With the phenomenon reproduced, the investigation could move from measurement to diagnosis.
4. Localizing the regression
The first diagnostic question was simple:
Does C256 get worse because the GPU stops being busy?
Nsight Systems contradicted that explanation.
In a separate diagnostic profiler workload, GPU kernel-active time was:
| Concurrency | Kernel-active fraction |
|---|---|
| 64 | 97.14% |
| 128 | 97.89% |
| 256 | 98.05% |
The post-knee regime is therefore not an idle-GPU transition.
At C256, the GPU is, if anything, fractionally more continuously occupied than at C128.
This matters because “GPU utilization” is too coarse to explain many inference regressions. A GPU can remain almost continuously active while spending its time on a less favorable composition of work.
So the useful question becomes:
What additional work is consuming GPU time at C256?
I grouped GPU kernels into broad families and normalized their summed kernel duration by generated output tokens.
| Kernel family | C128 | C256 | Delta |
|---|---|---|---|
| GEMM | 145.75 µs/tok | 136.65 µs/tok | −9.10 |
| Split-KV attention | 40.86 µs/tok | 57.08 µs/tok | +16.21 |
| Triton other | 14.13 µs/tok | 12.92 µs/tok | −1.22 |
| Other | 8.45 µs/tok | 5.56 µs/tok | −2.89 |
| Total | 209.20 µs/tok | 212.21 µs/tok | +3.01 |
The regression is not broad-based.
GEMM becomes cheaper per output token. The Triton bucket becomes cheaper. The miscellaneous bucket becomes cheaper.
The conspicuous increase appears in split-KV attention.
I then decomposed the dominant flash_fwd_splitkv_kernel by launch geometry.
Two characteristic paths appeared:
gridX=1: decode-oriented
gridX=9: mixed/prefill-containing
| FA2 path | C64 | C128 | C256 |
|---|---|---|---|
gridX=1 decode-oriented |
19.58 µs/tok | 16.89 µs/tok | 9.99 µs/tok |
gridX=9 mixed/prefill-containing |
12.21 µs/tok | 23.10 µs/tok | 46.27 µs/tok |
From C128 to C256, the decode-oriented path becomes cheaper by 6.91 µs/output-token.
The mixed/prefill-containing path becomes more expensive by 23.17 µs/output-token.
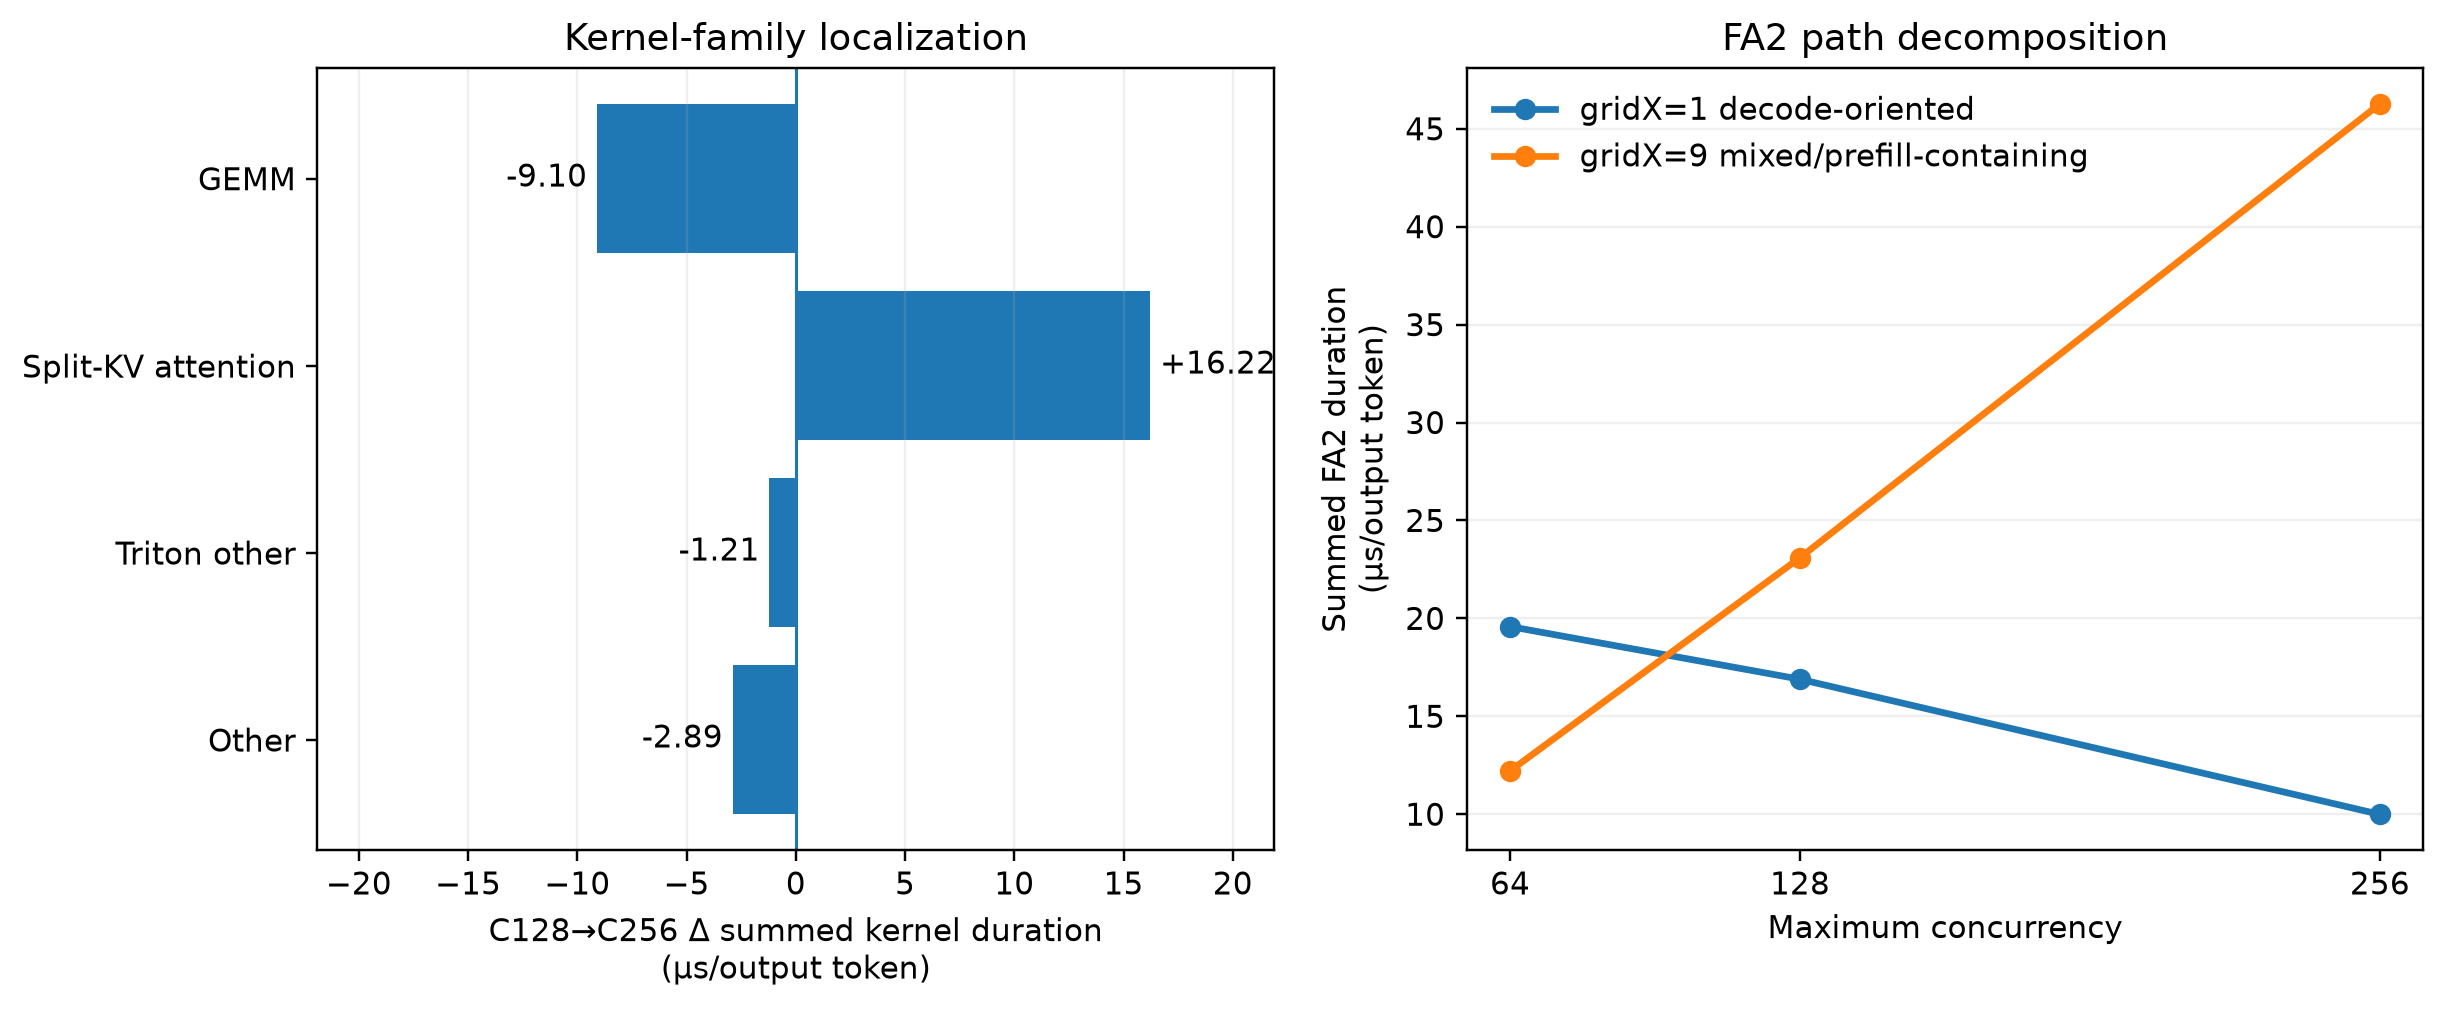
That distinction changes the diagnosis.
It would be inaccurate to say simply that “attention gets slower at higher concurrency.” One attention path becomes substantially cheaper per generated token.
The added cost is concentrated in the path associated with mixed/prefill-containing forwards.
Its launch count also increases markedly:
| Path | C64 | C128 | C256 |
|---|---|---|---|
gridX=1 | 8,892 | 8,496 | 7,684 |
gridX=9 | 1,368 | 2,664 | 5,400 |
At C256, that path appears more frequently and costs much more per output token.
The next question is what changed inside those forwards.
5. The sustained mixed/prefill regime
The mixed/prefill-containing FlashAttention launches occur once per transformer layer.
Qwen2.5-3B-Instruct has 36 transformer layers, so I reconstructed model forwards by grouping consecutive sets of 36 relevant launches.
The grouping has a useful internal consistency check: within each reconstructed forward, the relevant sequence dimension was identical across all 36 layer launches. That makes the grouping structurally coherent rather than an arbitrary partition of kernel events.
The trajectories reveal an initial filling phase followed by a sustained operating region.
At C128, the mixed/prefill path settles around 108–110 participating sequences.
At C256, it spends many consecutive forwards around 215–224.
| Regime | Mean sustained population | Mean kernel duration |
|---|---|---|
| C64 | 42.42 | 155.48 µs |
| C128 | 108.83 | 353.85 µs |
| C256 | 218.00 | 708.88 µs |
From C128 to C256:
sequence-population ratio = 2.0031×
kernel-duration ratio = 2.0033×
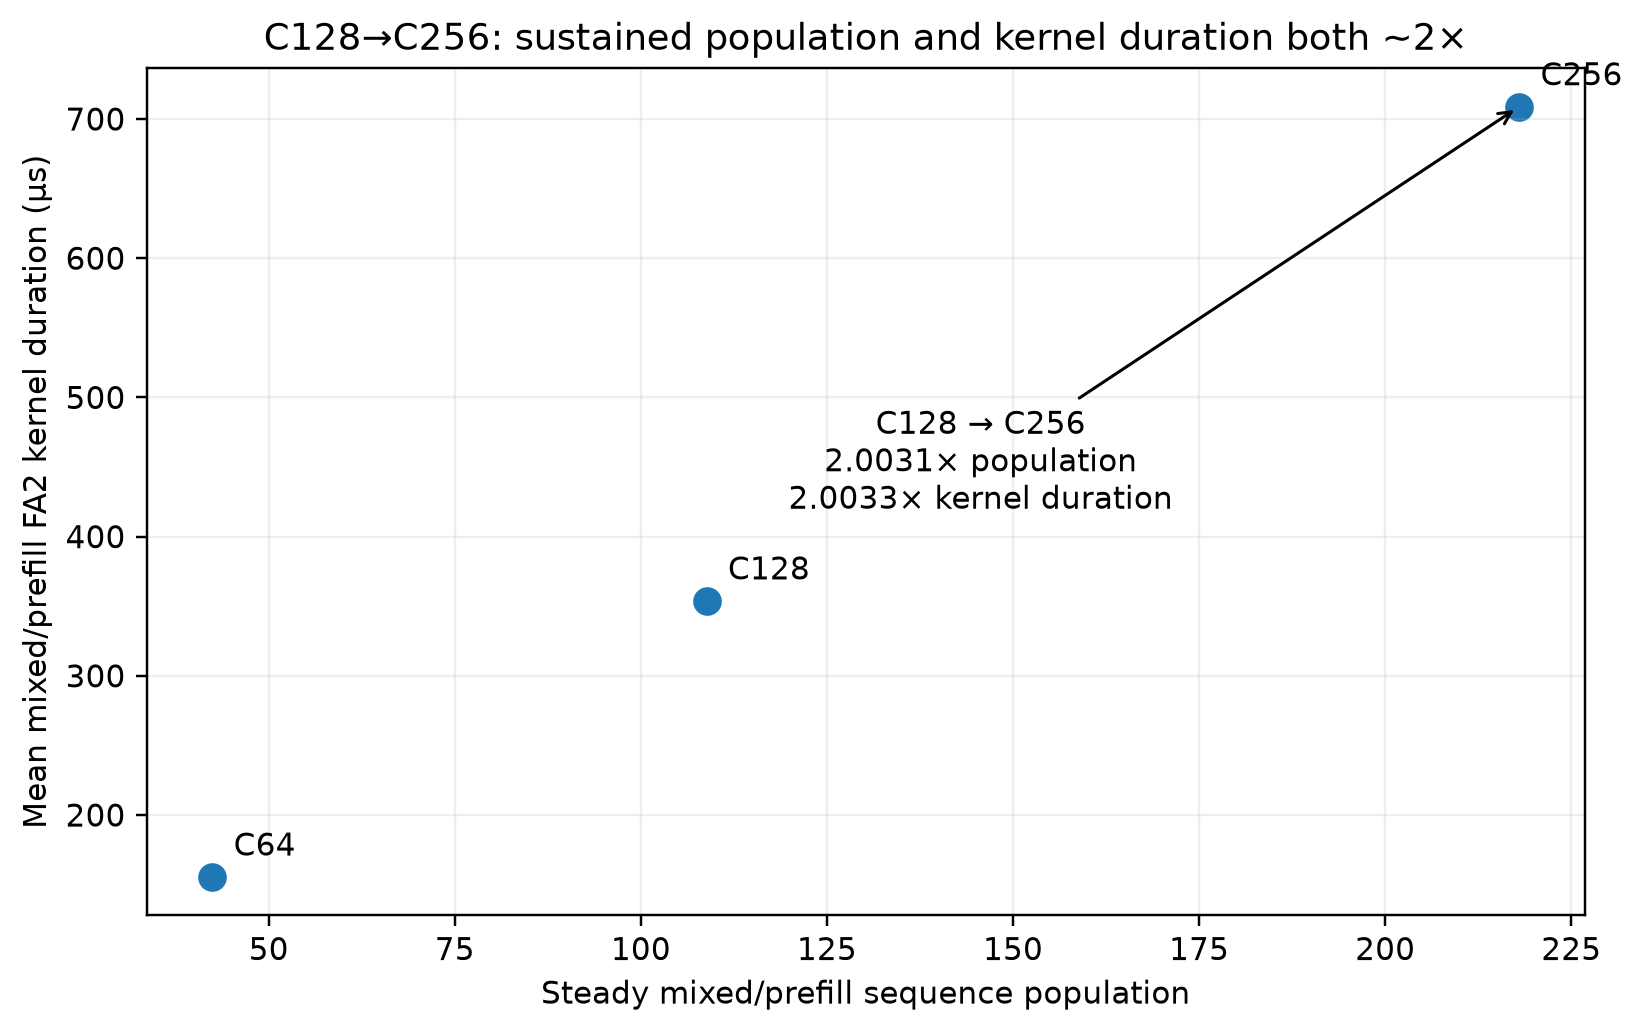
The significance is not merely the approximately 2× ratio.
The expensive C256 behavior persists across a sustained region. It is not an artifact of the initial ramp to 256 requests.
The proportionality should also not be generalized beyond what was observed.
C64 does not follow the same exact relationship, and within C256, kernel duration changes somewhat while sequence population remains similar. The trace therefore does not establish a universal equation in which FlashAttention runtime is determined solely by sequence population.
In the sustained C128 and C256 profiler regimes, the mixed/prefill sequence population approximately doubled, and the corresponding FlashAttention kernel duration approximately doubled with it.
That identifies where the additional GPU cost associated with the post-knee regime appears.
It does not yet establish the GPU microarchitectural reason for that cost.
6. Connecting the trace to the vLLM scheduler
For the exact vLLM 0.27.1 runtime used in this experiment, the V1 scheduler resolved to a shared scheduling budget of 2,048 tokens per step.
Chunked prefill was enabled.
No separate long_prefill_token_threshold override was present; its resolved value was zero.
The scheduling order matters.
The scheduler processes requests already in the RUNNING set first.
That should not be simplified to “decode first.” RUNNING work can contain both requests producing decode tokens and requests continuing a prompt prefill that was only partially scheduled earlier.
That running work consumes from the shared token budget.
Only afterward does the scheduler consider WAITING requests.
With chunked prefill enabled, a waiting prompt does not need enough remaining budget for its entire prompt. The scheduler can admit only the portion that fits in the current step. A partially computed prompt can then appear as continuing prefill work in later iterations.
This matters for the workload used here.
The benchmark was configured nominally for 512-token prompts, but the actual model-side inputs in the profiler run were approximately 540–541 tokens after tokenization and template processing.
configured concurrency
        ↓
larger admissible in-flight request population
        ↓
continuous batching under a shared 2048-token budget
        ↓
RUNNING decode + continuing prefill consume budget
        ↓
WAITING prompts use remaining budget via chunked prefill
        ↓
different sustained decode/prefill composition
        ↓
larger mixed/prefill attention population
        ↓
more GPU time in the gridX=9 FlashAttention path
The trace does not provide a direct request-level clock bridge into every CUPTI kernel event. The diagnostic run lacked harness-level NVTX markers that would allow benchmark request timestamps to be mapped mechanically into the trace timestamp domain.
I therefore do not claim an exact token-by-token reconstruction of every 2,048-token scheduler step.
What the evidence supports is the systems-level connection.
Higher configured concurrency changes the amount of work available to the continuous-batching scheduler. Under the same fixed scheduling budget and chunked-prefill policy, C256 enters a sustained regime with approximately twice the mixed/prefill sequence population observed at C128.
The scheduler provides a concrete systems mechanism by which higher concurrency can change workload composition; the trace shows the resulting regime difference.
That is sufficient for a systems-level attribution without inventing a microarchitectural explanation.
7. What this establishes — and what it does not
The throughput knee is repeatable: C128 beats C256 in all three canonical runs with coefficients of variation below 0.4%.
The ordering survives a fresh-host clean-room reproduction.
C256 is dominated by C128 on both throughput and latency for this workload.
The post-knee regime is not caused by the GPU going idle; kernel-active time remains approximately 98%.
The additional normalized GPU cost is localized rather than broad-based. GEMM and decode-oriented FlashAttention improve, while mixed/prefill-containing FlashAttention becomes substantially more expensive.
And the expensive path operates with a much larger sustained participating sequence population at C256.
What this investigation does not establish is the GPU microarchitectural reason why a representative C256 mixed/prefill kernel takes approximately twice as long as the corresponding C128 kernel.
I did not run Nsight Compute for this article.
I therefore make no claim that the underlying cause is DRAM bandwidth, L2 behavior, occupancy, warp stalls, cache locality, CTA scheduling, or another specific hardware mechanism.
The approximately 2× C128→C256 relationship is also not a universal FlashAttention scaling law.
And C128 is not claimed to be a universal optimum for vLLM, this model, or A100s.
Under this controlled saturated vLLM/A100 workload, there is a reproducible concurrency knee between C128 and C256. Profiler evidence localizes the post-knee cost increase to a sustained mixed/prefill attention regime associated with continuous batching under the scheduler’s fixed token budget.
That is a systems-level attribution.
It intentionally stops short of a microarchitectural one.
8. What this means for inference benchmarking
Three lessons generalize beyond this specific workload.
Concurrency is a control variable, not a capacity metric
C256 successfully serves requests, but that does not make it a better operating point.
Here it delivers fewer output tokens per second while substantially worsening TTFT and TPOT.
Production capacity ultimately depends on a workload and latency objectives. The largest concurrency value that runs — or even the point with the highest isolated throughput — is not automatically the most useful operating point.
Small throughput differences need repetition
The C128→C256 throughput difference is only a few percent.
From one run, that result would deserve skepticism.
Across three balanced repeats, however, C128 beat C256 every time while coefficients of variation remained below 0.4%.
Small claimed improvements or regressions should survive enough repetition to distinguish a real regime change from ordinary noise.
Benchmarking and profiling are different evidence
The headline performance numbers in this article come from clean, unprofiled runs.
The mechanism analysis comes from a separate, shorter Nsight Systems workload.
That separation is deliberate.
Clean benchmark: Does the performance phenomenon exist?
Profiler: Where does additional GPU time appear when the regime changes?
Profilers perturb execution, and diagnostic traces often require shorter workloads for tractability. The profiler's normalized kernel-cost deltas are therefore not treated as a numerical reconstruction of the canonical throughput regression.
The experiment was also reproduced on a fresh A100 host using an immutable runtime, exact model revision, and pinned repository state. That clean-room test exposed one undeclared post-processing dependency, which was removed before restarting the run from scratch.
Full runtime provenance, raw artifacts, analysis code, and deterministic figure generation are retained in the accompanying repository rather than repeated in the main narrative.
Conclusion
Increasing concurrency from 64 to 128 improved output throughput from approximately 4.26k to 5.00k tok/s.
Increasing it again to 256 reduced throughput to approximately 4.77k tok/s, while mean TTFT increased by about 78%, p99 TTFT more than doubled, and mean TPOT more than doubled.
The ordering survived every canonical repeat and a fresh-host clean-room reproduction.
Nsight Systems showed that the post-knee regime was not caused by GPU idleness. Kernel-active time remained around 98%. Instead, the added cost was concentrated in a mixed/prefill-containing FlashAttention path.
Between C128 and C256, the sustained mixed/prefill sequence population increased from 108.83 to 218.00, while mean kernel duration increased from 353.85 µs to 708.88 µs. At the same time, GEMM and decode-oriented FlashAttention became cheaper per generated token.
Inspection of the vLLM V1 scheduler source provides a systems mechanism consistent with that regime change: continuous batching operates under a shared 2,048-token scheduling budget across running decode, continuing prefill, and newly admitted prompt chunks.
Concurrency is not capacity. It is a control variable that can move an inference server into a different performance regime.
Finding that knee requires measuring throughput and latency together.
Explaining it requires following the effect from serving behavior, through scheduling, into the GPU workload.
That is where peak throughput stops being the interesting number.
Reproducibility
The frozen evidence package for this investigation is available on GitHub:
Article #1 Evidence — vLLM Concurrency Knee on A100 →
Environment: NVIDIA A100-SXM4-80GB · Qwen2.5-3B-Instruct · vLLM 0.27.1 · BF16
Model revision:
aa8e72537993ba99e69dfaafa59ed015b17504d1
Clean-room experiment commit:
1d721051945defd8898916a986fc696286e7946d
Frozen Article #1 release:
article1-v1.0
Frozen publication commit:
144242692b48c29e27946adbb8ea8f041e82a74c